
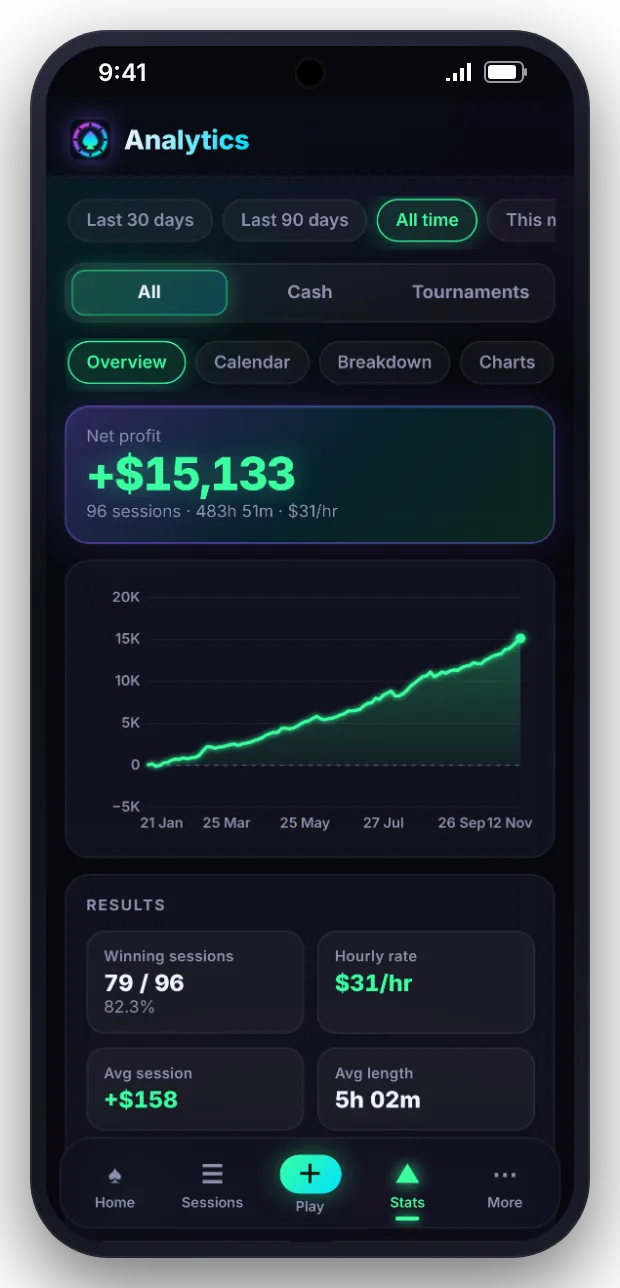
Stack Market turns your sessions into the numbers that matter: net profit, hourly rate, win rate and big blinds per hour. Break your results down by stakes, venue, game, format, day, time of day or session length, and see every winning and losing day on a monthly calendar.
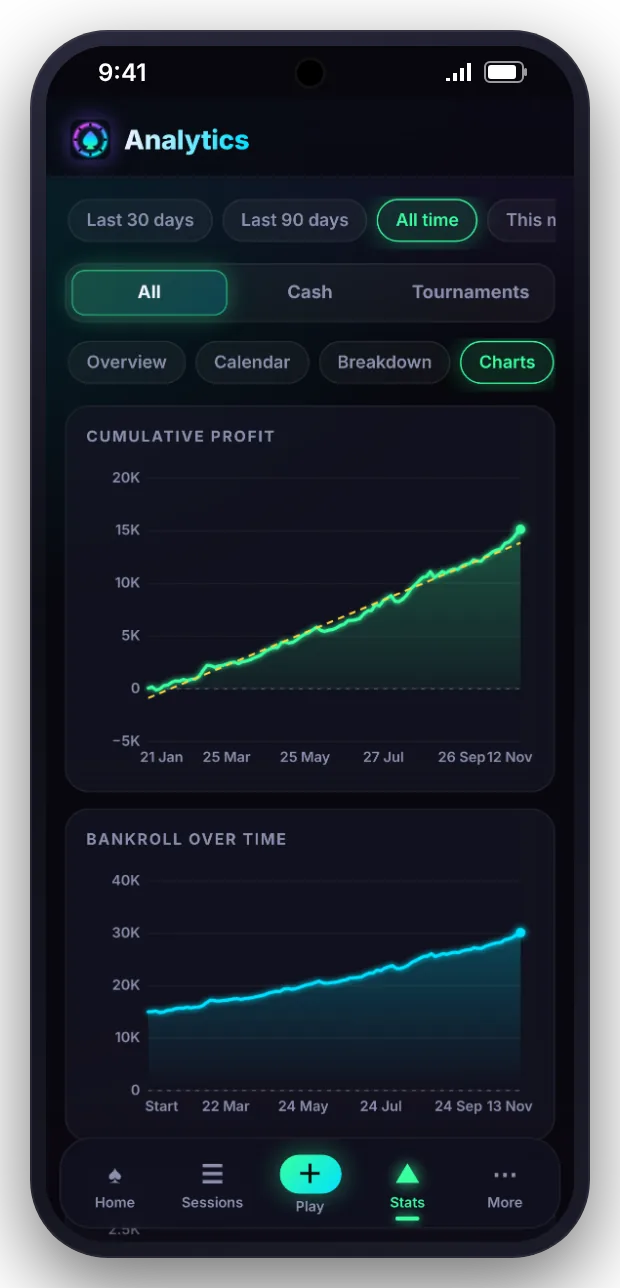

Cumulative profit, bankroll over time, monthly profit and the distribution of your session results, for any period and any format.
Compare results by stake and format, venue, day of the week and session length. Hourly rate by stake shows which games are worth the time.

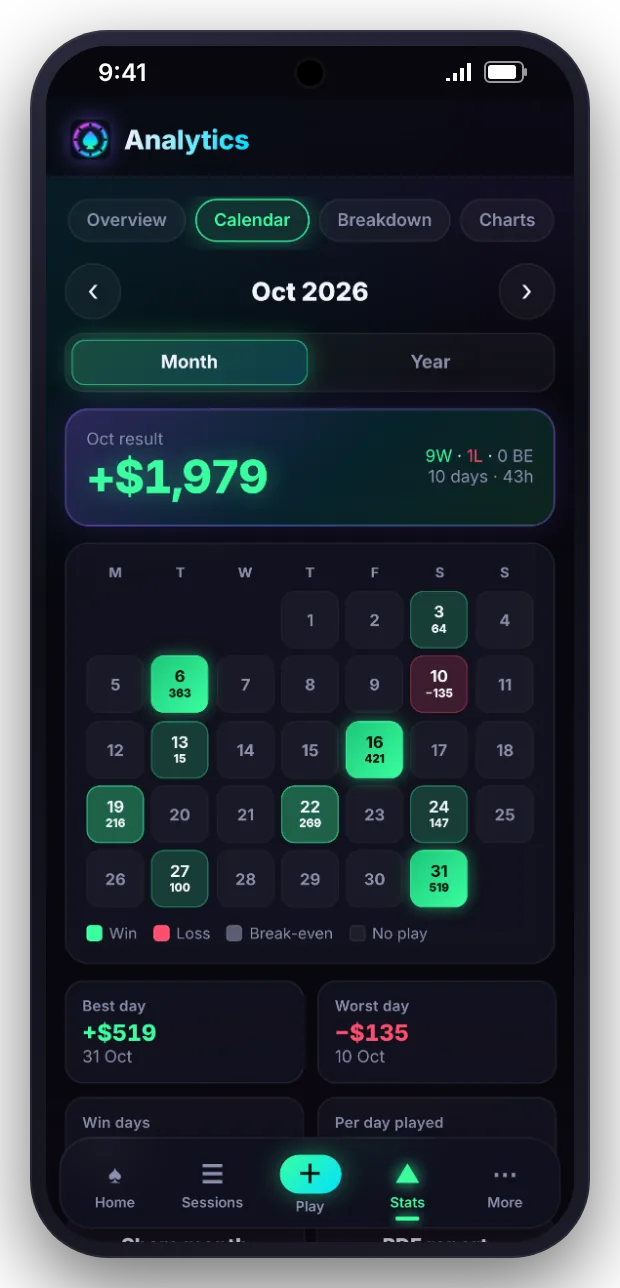
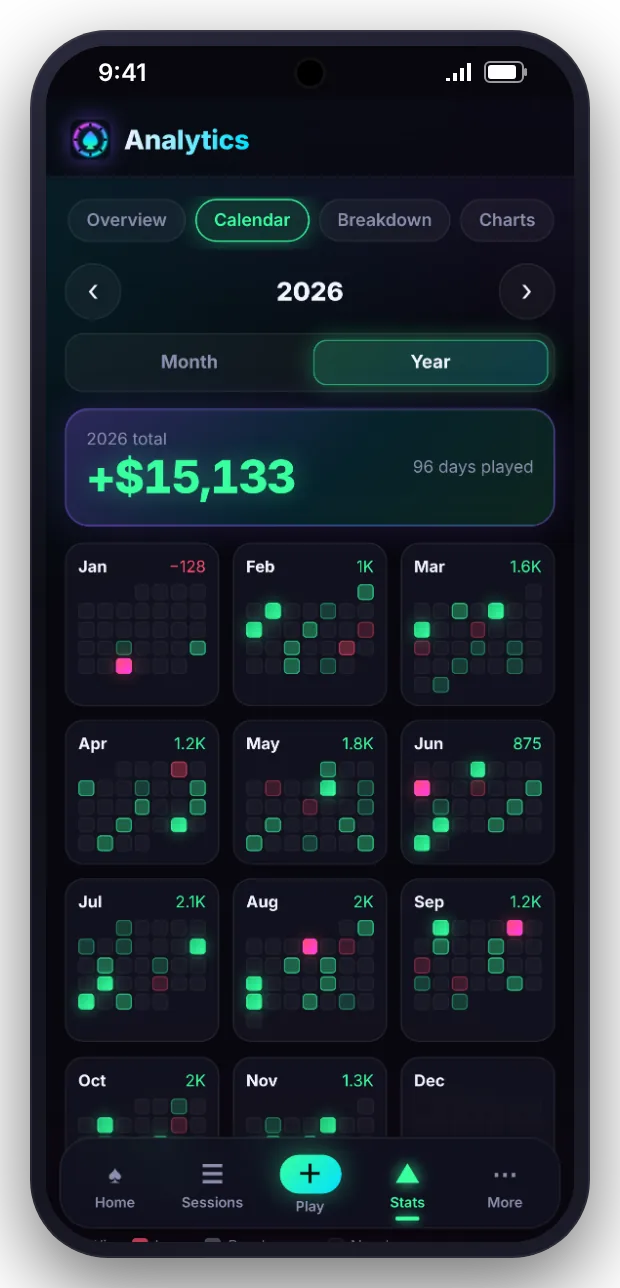
Month and year views colour each day by result. Tap a day to see the sessions behind it.
Stack Market looks for patterns such as long sessions that lower your hourly rate or stakes where results differ, and states them in a sentence you can act on.
Last 30 days, last 90 days, this year, all time or a custom range.
Cash games, tournaments and Sit & Gos together or on their own.
Compare card rooms, home games and online play.
Turn a session, a month or any date range into a clean image to share.
Export your sessions to CSV for Excel or Google Sheets.
Every calculation happens on your phone.
Anything else? Ask in the beta group and we will answer.
Hourly rate is your net result divided by the hours you actually played. Playing time runs from the start to the end of each session, minus any breaks you logged. That gives you a figure you can compare across stakes, venues and months.
Win rate is the percentage of your sessions that finished in profit. It tells you how often you leave the table ahead. For cash games, Stack Market also shows big blinds won per hour, which measures how much you win relative to the stakes you play.
Yes. The breakdown view groups your sessions by stakes, venue, city, venue type, game, format, day of the week, time of day, session length and more. Each group shows sessions played, net result, hourly rate and win rate, so you can see where you do best.
Yes. Group your results by session length to compare short and long sessions on net result, hourly rate and win rate. You can also set a maximum session length in Settings, and a live session will remind you when you have played past it.
You can view them together or apart. Filter your statistics to cash games only, tournaments only, or everything. Cash games show big blinds per hour, while tournaments show return on investment, because each format is measured in the way that makes sense for it.
Join the beta to get Stack Market on Android.