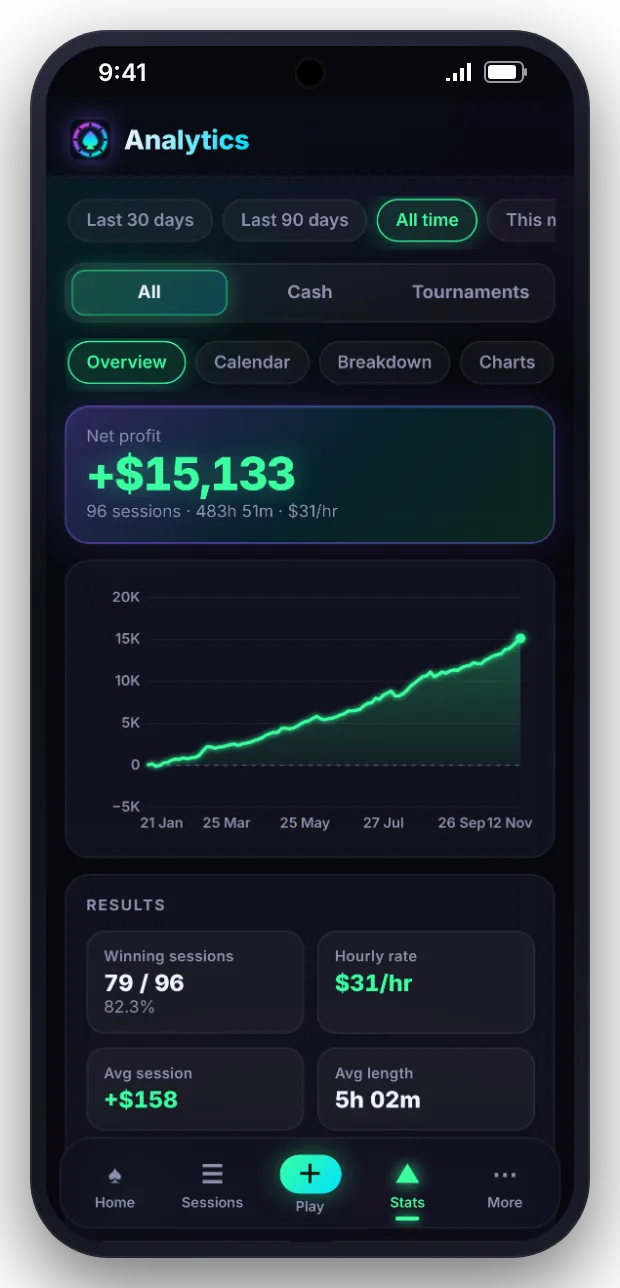
Stack Market turns your sessions into charts, breakdowns and plain-language insights, so you can see which games, stakes and habits are making you money and which are costing it.
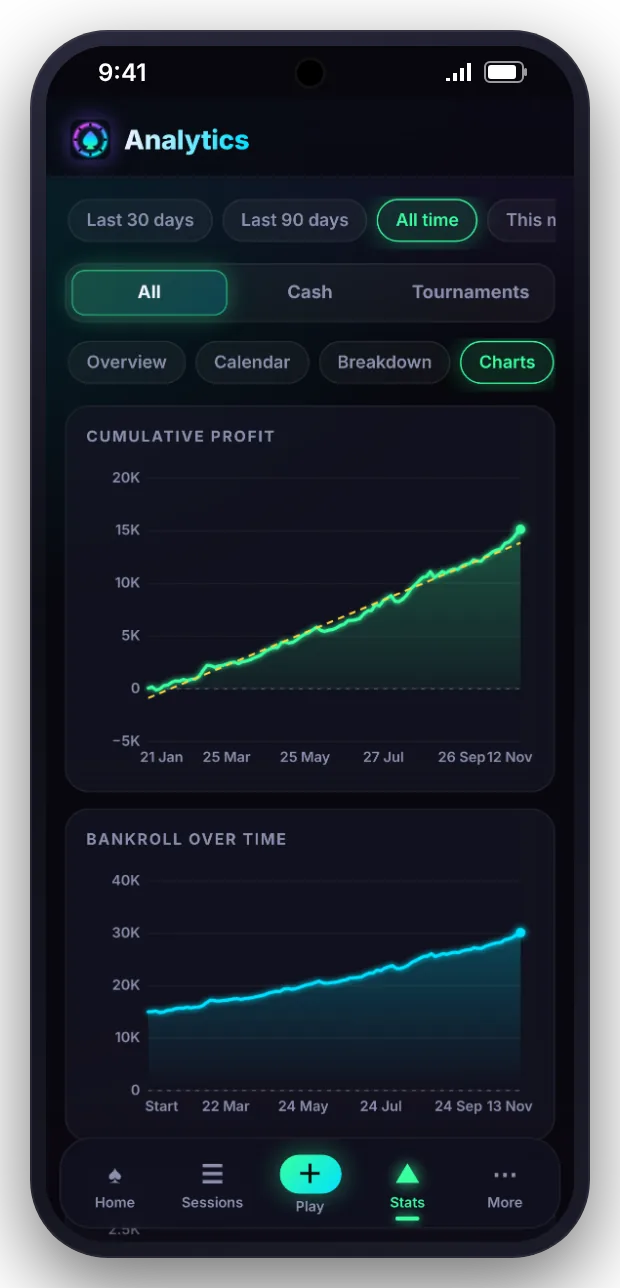
Cumulative profit, bankroll over time, monthly profit and the distribution of your session results, for any period and any format.
Cumulative profit and bankroll
Monthly profit
Session results distribution
Breakdowns
Find where your edge actually is.
Compare results by stake and format, venue, day of the week and session length. Hourly rate by stake shows which games are worth the time.
Hourly rate by stakes
Profit by day of the week
Hourly rate by session length
Calendar
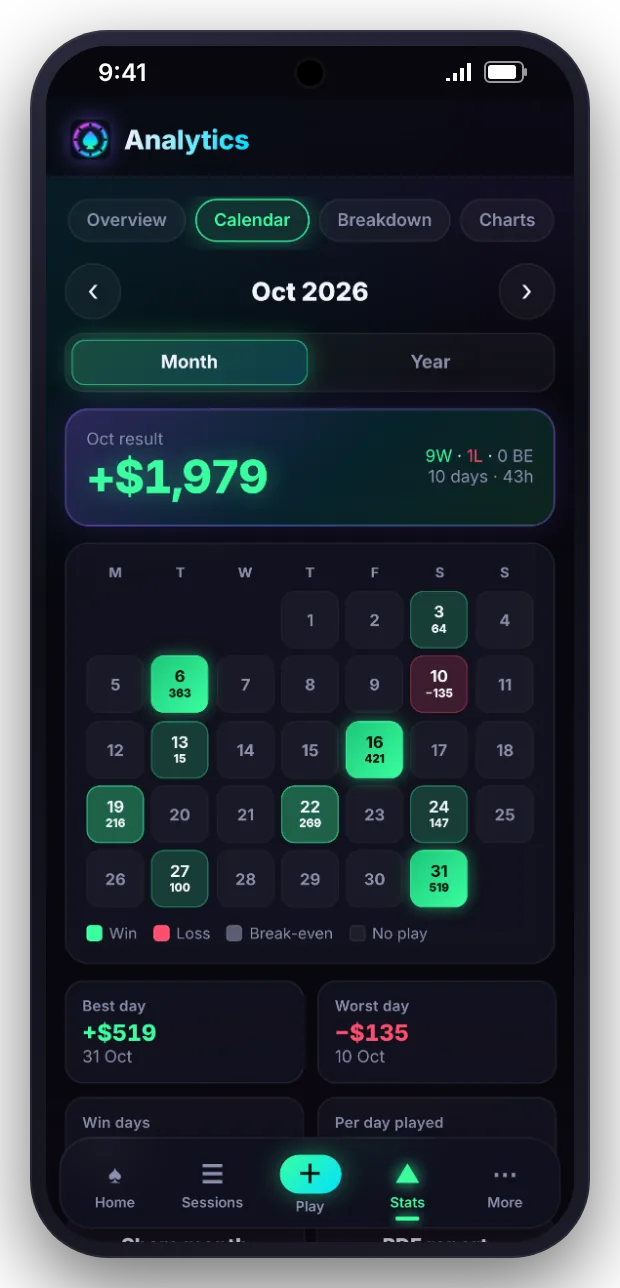
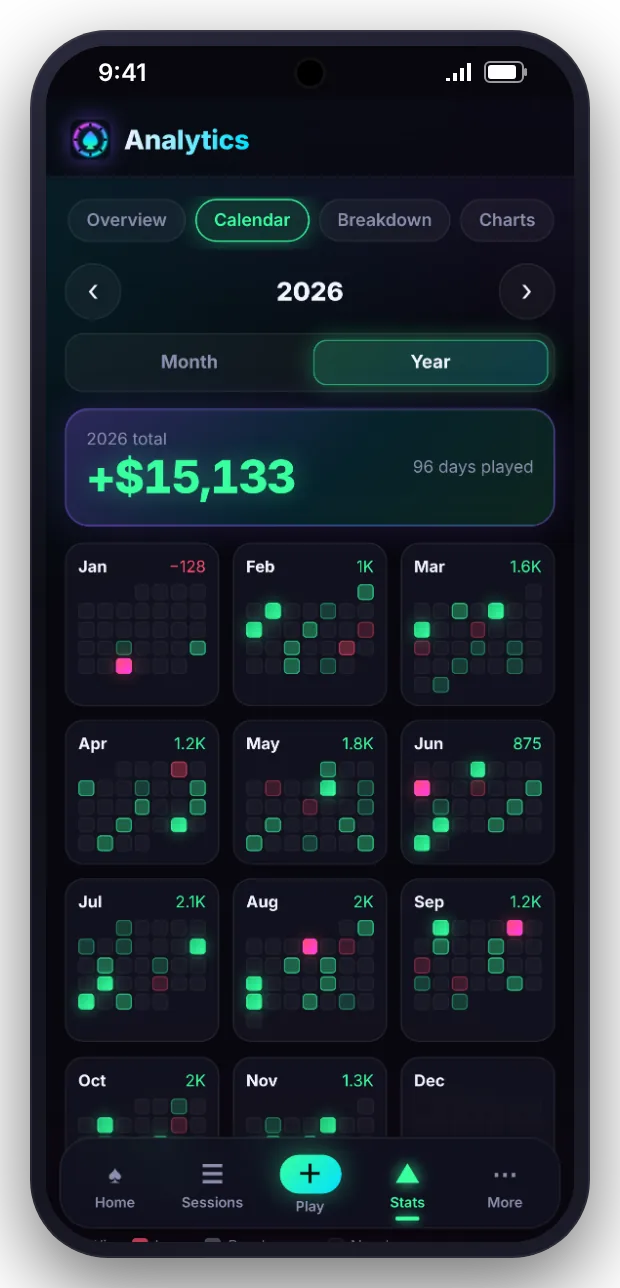
Every winning and losing day at a glance.
Month and year views colour each day by result. Tap a day to see the sessions behind it.
Day, month and year views
Results coloured by day
Open any day to see its sessions
Insights
Your data, stated plainly.
Stack Market looks for patterns such as long sessions that lower your hourly rate or stakes where results differ, and states them in a sentence you can act on.
Habits and form
Risk and variance
Consistency and swings
Filters
Slice the numbers any way you need.
Any period
Last 30 days, last 90 days, this year, all time or a custom range.
Any format
Cash games, tournaments and Sit & Gos together or on their own.
Any venue
Compare card rooms, home games and online play.
Share cards
Turn a session, a month or any date range into a clean image to share.
Export
Export your sessions to CSV for Excel or Google Sheets.